Below the National Headline: How County-Level Yield Intelligence Is Generating Real Competitive Advantage
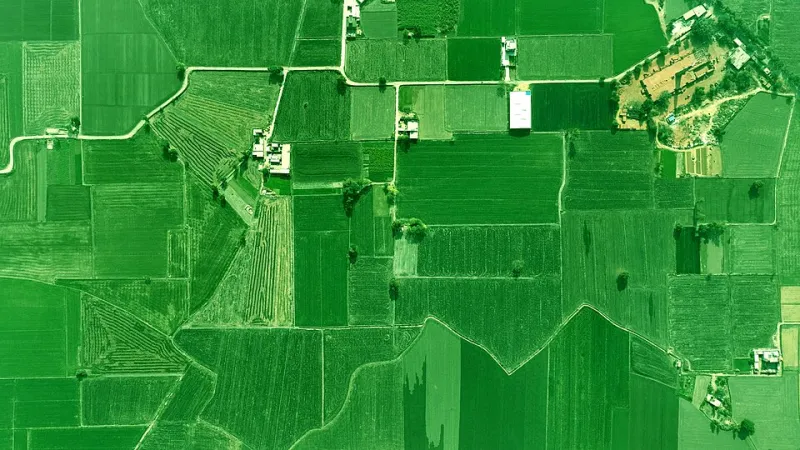
Photo: Bhullargraphic, CC BY-SA 4.0, via Wikimedia Commons
Every August, the USDA's World Agricultural Supply and Demand Estimates report moves markets. Traders parse every bushel of the national corn or soybean production figure, and headlines follow within minutes. Yet for a grain elevator manager in central Illinois or a cash merchandiser operating across three Iowa counties, that headline number may be the least useful data point available. The national average, by design, flattens the very variability that creates opportunity.
At Martell Crop Projections, our analytical work consistently returns to a foundational premise: aggregation conceals intelligence. The further you drill below the national estimate, the more actionable the signal becomes—provided you have the tools and the discipline to interpret it.
Why National Averages Systematically Mislead Local Decision-Makers
Consider what a national corn yield estimate of 181 bushels per acre actually represents. It is a weighted composite of production outcomes across dozens of states, hundreds of counties, and thousands of fields—each operating under distinct soil profiles, drainage infrastructure, growing degree day accumulations, and pest pressure regimes. A drought that cuts yields by 20 percent in western Nebraska may be entirely offset by ideal conditions across the eastern Corn Belt. The national number absorbs both realities and reports neither.
For a producer or merchandiser whose competitive position depends on understanding what is happening within a 50-mile radius, that composite figure offers almost nothing. The basis at a local elevator is not set by national supply. It is set by the volume of grain moving toward that specific facility relative to that facility's capacity and demand. County-level production variability—not national trends—is what drives those micro-market dynamics.
This is precisely where precision forecasting at the sub-state level earns its keep.
The Building Blocks of a County-Level Yield Model
Constructing a reliable county-level yield model requires assembling several data streams that national analysts rarely integrate with sufficient granularity.
Soil type and drainage classification form the foundation. USDA's Web Soil Survey provides county-level soil productivity ratings, but experienced agronomists go further—mapping tile drainage density, field slope, and organic matter variability to identify which geographies are most sensitive to excess moisture events or drought stress during critical growth stages. A county with heavy clay soils in its northern tier behaves very differently from its southern sandier acreage during a wet spring.
Localized weather data is the second pillar. National weather models provide regional temperature and precipitation grids, but county-level forecasters increasingly rely on networks of private weather stations and interpolated satellite data to track growing degree day accumulations at a township scale. During the 2023 growing season, for instance, a late frost event that affected portions of northern Indiana created meaningful intra-state yield divergence that state-level USDA estimates did not fully capture until the November crop production report—months after local merchandisers with granular weather intelligence had already adjusted their basis offers accordingly.
Pest and disease pressure mapping adds a third dimension that national forecasters routinely underweight. Soybean aphid infestations, tar spot in corn, and sudden death syndrome in soybeans all exhibit strong geographic clustering. Extension service reports, agronomist field scouting networks, and satellite-derived vegetation stress indices can flag elevated risk in specific counties weeks before yield impacts appear in official survey data.
Historical yield variance by county completes the framework. County-level yield histories—available through USDA's National Agricultural Statistics Service—reveal which geographies carry the highest year-to-year production volatility relative to their state average. High-variance counties deserve a wider confidence interval in any projection and, correspondingly, larger basis adjustments when conditions tilt toward the tail of the distribution.
Translating Local Yield Intelligence Into Positioning Decisions
The commercial value of county-level forecasting materializes most clearly in two areas: basis management and forward contracting timing.
Consider a scenario from the 2022 growing season in western Kentucky. A stretch of August heat stress reduced soybean pod fill across several counties in the Jackson Purchase region while conditions remained largely favorable statewide. A merchandiser monitoring localized NDVI satellite data and private weather station records identified the developing yield shortfall roughly six weeks before the September NASS survey reflected it. That lead time allowed for strategic adjustment of forward contract positions and basis bids—capturing margin that would have evaporated once the regional supply picture became public knowledge.
Similarly, on the production side, growers who understand their county's yield trajectory relative to the state average can make more informed storage and marketing decisions. If local production is running 12 percent below the state average while elevator capacity in the region remains unchanged, basis strength at harvest is mathematically more likely—rewarding producers who hold unpriced grain rather than forward selling into a market priced off statewide assumptions.
The Proprietary Model Advantage
Large commodity trading firms have invested heavily in proprietary crop intelligence for decades. Satellite imagery subscriptions, private weather networks, and field scouting services are standard tools for organizations operating at scale. What has shifted in recent years is the accessibility of these inputs for regional operators.
Commercial satellite vegetation index products, county-level weather API services, and machine learning tools capable of integrating multi-variable datasets have lowered the barrier to building genuinely competitive local forecasting capabilities. Precision agriculture service providers are increasingly packaging these tools in ways accessible to mid-sized elevator operations and regional merchandising desks.
The competitive moat, however, is not the data itself—it is the interpretive framework applied to it. Raw NDVI values or county precipitation anomalies are inputs, not conclusions. The organizations generating consistent edge are those that have developed structured analytical processes for converting those inputs into probabilistic yield estimates, and then translating those estimates into specific merchandising or contracting actions.
What This Means for Producers and Merchandisers
For grain producers, the practical implication is straightforward: understanding your county's relative yield position—not just your own farm's performance—should inform your marketing timeline and storage decisions each season. A farm yielding at its historical average in a county running well below average is a fundamentally different marketing situation than the same farm yield in a county performing at or above trend.
For merchandisers and elevator operators, investing in county-level forecasting capacity is increasingly a prerequisite for competitive basis management rather than a differentiating luxury. As more market participants gain access to satellite and weather intelligence tools, the advantage will shift toward those who have built the analytical infrastructure to act on that information faster and with greater precision.
National crop estimates will continue to anchor the broader market. But the profit is almost always found in the gap between what the national number implies and what local conditions actually deliver—and that gap is measured at the county line.