Reading Between the Bids: How Basis Movements Reveal What Elevators Won't Tell You About Your Grain
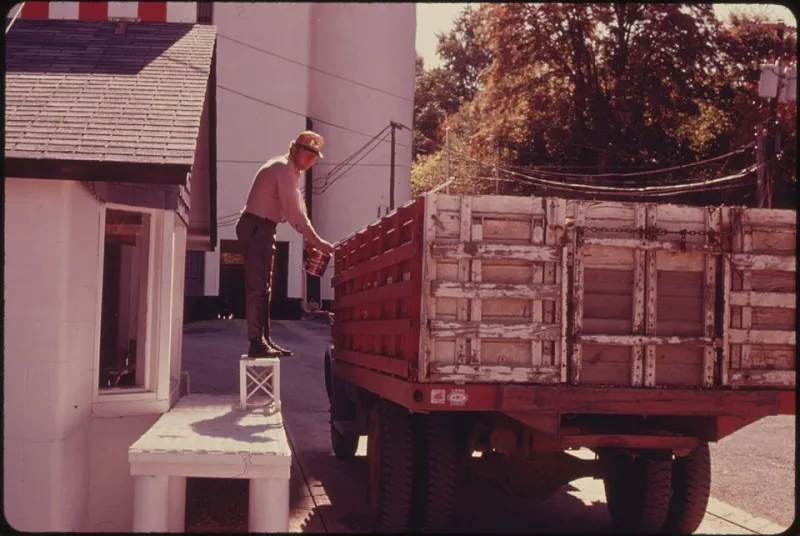
Photo: Patricia DuBose Duncan, Public domain, via Wikimedia Commons
The Number on the Board Isn't the Whole Number
Every harvest season, millions of bushels of corn and soybeans change hands based on a number posted on a whiteboard or displayed on a grain elevator's website. Farmers call their local buyer, hear the cash bid, and make a decision. What many don't pause to consider is that this number is a composite—a futures price adjusted by a local variable that carries enormous strategic information. That variable is basis.
Basis is defined simply as the local cash price minus the relevant futures contract price. If December corn futures are trading at $4.80 per bushel and your elevator is bidding $4.50, your basis is negative 30 cents, commonly written as "minus 30." If that same elevator bids $4.95 against the same futures, basis is positive 15. But the math is the easy part. The hard part—and the valuable part—is understanding why basis sits where it does, and where it is likely to move.
What Basis Is Actually Measuring
At its core, basis reflects the cost and friction of connecting your grain to a consuming market. It captures several forces simultaneously: transportation costs from your location to the nearest terminal or processing facility, local supply and demand conditions, elevator handling and storage margins, and the carrying charges embedded in the futures market itself.
When basis weakens—meaning the local cash price falls further below futures—it typically signals one of several conditions. Local supply may be heavy, as happens immediately after harvest when elevators are filling and trucks are lined up. Transportation bottlenecks may be limiting the elevator's ability to move grain efficiently. Or end-user demand in your region may be soft relative to available supply.
Conversely, when basis strengthens and the gap between cash and futures narrows or even inverts, the market is telling a different story. Nearby demand is outpacing local supply. An ethanol plant may be running hard. A river terminal may be buying aggressively to fill barge positions. A crush facility may have contracted forward and is now scrambling for nearby bushels. These are not abstractions—they are actionable signals.
The Seasonal Basis Curve as a Forecasting Tool
One of the most underutilized tools in grain marketing is the historical seasonal basis chart. For any given location, basis follows a broadly predictable annual pattern, though the amplitude varies considerably by year and by region.
For corn in the eastern Corn Belt, basis typically reaches its weakest point in October and November, when harvest-time supplies overwhelm local handling capacity. It then tends to strengthen gradually through winter and into spring as supplies tighten, carry charges are earned out, and demand from feedlots, ethanol plants, and export channels absorbs the available bushels. By late spring and early summer, basis at many inland locations has recovered substantially from its harvest-time lows.
This pattern is not a guarantee—it is a probability distribution shaped by years of market behavior. Understanding where current basis sits relative to its historical seasonal range is one of the most direct ways to assess whether storage is likely to be rewarded. If basis is already historically strong at harvest, the forward curve for basis improvement may be limited. If it is historically weak, the potential for basis recovery—and thus the case for on-farm or commercial storage—becomes more compelling.
Regional Variation: Why State Lines Don't Define Basis Zones
A critical and often misunderstood dimension of basis is how dramatically it varies across short geographic distances. Two elevators 40 miles apart can post basis levels that differ by 20 cents or more, not because one is offering a better deal, but because they are serving different supply chains with different logistical constraints.
An elevator positioned near a major river with reliable barge access to Gulf export terminals will typically post a stronger basis than an inland elevator dependent on rail or truck to reach a terminal. A facility adjacent to a large ethanol plant or soybean crush operation will often post basis premiums that reflect that end user's demand pull. Meanwhile, an elevator in a geographically isolated area with limited competition may post persistently weak basis simply because it faces fewer competitive pressures.
For farmers operating across multiple counties or states, benchmarking basis across several delivery points is not optional—it is fundamental to capturing full value. The difference between the weakest and strongest basis in a given region can easily exceed the margin between a profitable and unprofitable marketing year.
Inverted Markets, Carry Markets, and What They Signal
The relationship between basis and the futures spread—the difference between nearby and deferred contract prices—is another layer worth understanding. When futures are in a "carry" market, meaning deferred contracts trade at a premium to nearby contracts, the market is effectively offering payment for storage. The futures curve is signaling that supply is adequate now but tighter later, and it is incentivizing those who can store to hold bushels off the market.
When futures are inverted—nearby contracts trading above deferred—the market is communicating urgency. It wants grain now, not later. In an inverted market, the economics of storage deteriorate quickly, and the strategic response is often to move grain promptly rather than carry it in hopes of a basis recovery that the market structure suggests is unlikely.
Reading basis alongside the futures spread gives a far more complete picture of where the market stands than either data point alone.
Practical Steps for Incorporating Basis Intelligence
For agricultural professionals looking to move beyond reactive selling, the following practices provide a structured foundation.
First, track basis at multiple delivery points consistently throughout the year, not just at harvest. Maintaining a simple spreadsheet with weekly cash bids and the corresponding futures price builds a local basis history that becomes increasingly valuable over time.
Second, compare current basis levels to the three- to five-year historical average for the same week of the year. This comparison reveals whether basis is historically wide or narrow, which informs the probability of future strengthening or weakening.
Third, monitor the futures spread alongside basis. When the carry in the futures market exceeds the cost of storage—including interest, shrink, and handling—the market is offering a genuine incentive to store. When it does not, the calculus changes.
Finally, pay attention to regional news that affects basis drivers: new processing facilities coming online, rail service disruptions, river closures, or changes in export pace. These developments often move basis before they move futures, giving attentive producers a meaningful timing advantage.
The Bid Is a Starting Point, Not a Verdict
The elevator's posted bid is a useful reference, but it is not a complete assessment of your grain's worth in the marketplace. Basis analysis transforms a passive price-taker into an informed market participant—one who understands not just what the market is offering today, but what the structure of prices is suggesting about where value is likely to migrate. In a business with margins as thin as modern grain farming, that distinction is worth cultivating.